Watch AI redraw the software stack, in real install data.
EnsemblAI tracks demand across PyPI and npm — every package, every corporate maintainer, every download trend. See which frameworks, SDKs, and agent toolchains the industry is actually adopting — and what they’re displacing — with watchlists, alerts, ensembles, and a REST + MCP API on top.
Free tier · no credit card · 5 watchlist packages, 12 months history
Everything you need to read software demand.
Install-level download data across two registries, enriched with corporate ownership, license, and industry domain — exposed through a dashboard, a REST API, and an MCP server.
Demand analytics
Monthly + weekly time series for any package, with CI vs non-CI splits, geography breakdowns, and growth movers across PyPI and npm.
Dependency graphs
Forward fan-out + cohort analysis. Ecosystem clusters discovered via Louvain on the dependency graph — "which packages travel together?"
AI agent
Ask in plain language, get live charts in a split-view workspace. Refine them in conversation, pin the keepers, promote any chart to a tracked alert. The interface adapts to your question — not the other way around.
Watchlists, alerts + ensembles
Pin packages, group them into named ensembles, set threshold rules on growth and get told in-app when one trips. Or just tell the agent to set it all up and approve with one click.
REST API + MCP server
Programmatic access to every metric, with per-tier rate limits and overage billing. MCP tools for Claude Desktop and Cursor (Pro).
Dependency vulnerability audit
Upload a requirements.txt, pyproject.toml, or package.json + lockfile and we scan every entry against OSV.dev for known CVEs. Full audits on Pro.
Ask the question, not the package.
A registry API returns one package at a time over a short recent window, with no search and no ranking. EnsemblAI is built for the questions that need the whole ecosystem at once.
“Which AI/ML packages grew fastest this quarter?”
Ranked across 5.3M packages by growth, downloads, stars or quality — with 41 filters to narrow it. A registry has no search and no ranking.
Ask it“How is all of AI/ML trending — as one curve, not 40,000?”
Whole-segment series: all 20 domains and 80 categories carry their own multi-year aggregate. One call, not a warehouse project.
Ask it“What does Google — or Anthropic — actually publish, and how much of it is used?”
2,800+ companies and 42,312 GitHub orgs mapped to their packages, with combined totals and domain mix.
Ask it“Is this growth people installing it, or pipelines re-installing it?”
CI and non-CI downloads stored separately, and US vs. rest-of-world as a filter, so the question is a query rather than a guess.
Ask it“What did requests look like in 2019?”
npm history from 2015 and PyPI from 2018, at weekly and monthly resolution. Registry endpoints keep 6 to 18 months.
Ask it“Which packages travel together — and what depends on this one?”
22.3M dependency edges for both ecosystems in the same shape, what depends on a package ranked by downloads, and 554 discovered communities of PyPI packages.
Ask it“Did PyPI downloads really fall a third in August 2026?”
No. On 2026-08-24 PyPI stopped logging metadata fetches that were never downloads in the first place, so raw counts step down about 35% overnight and every year-over-year comparison across that date breaks. EnsemblAI counts real package downloads only, for all time — one basis end to end, no step on any date — so trends, rankings and growth stay comparable. Where another source reads higher for 2023–2026, that is its overcount.
How we count downloadsStop navigating dashboards. Start asking questions.
Most data platforms hand you a fixed UI built for someone else’s use case — then charge an enterprise premium for the API to escape it. EnsemblAI builds the analyst into the product: ask in plain language, get real charts on live data, refine them in conversation, and keep what matters. Access is the baseline. Answers are the product.
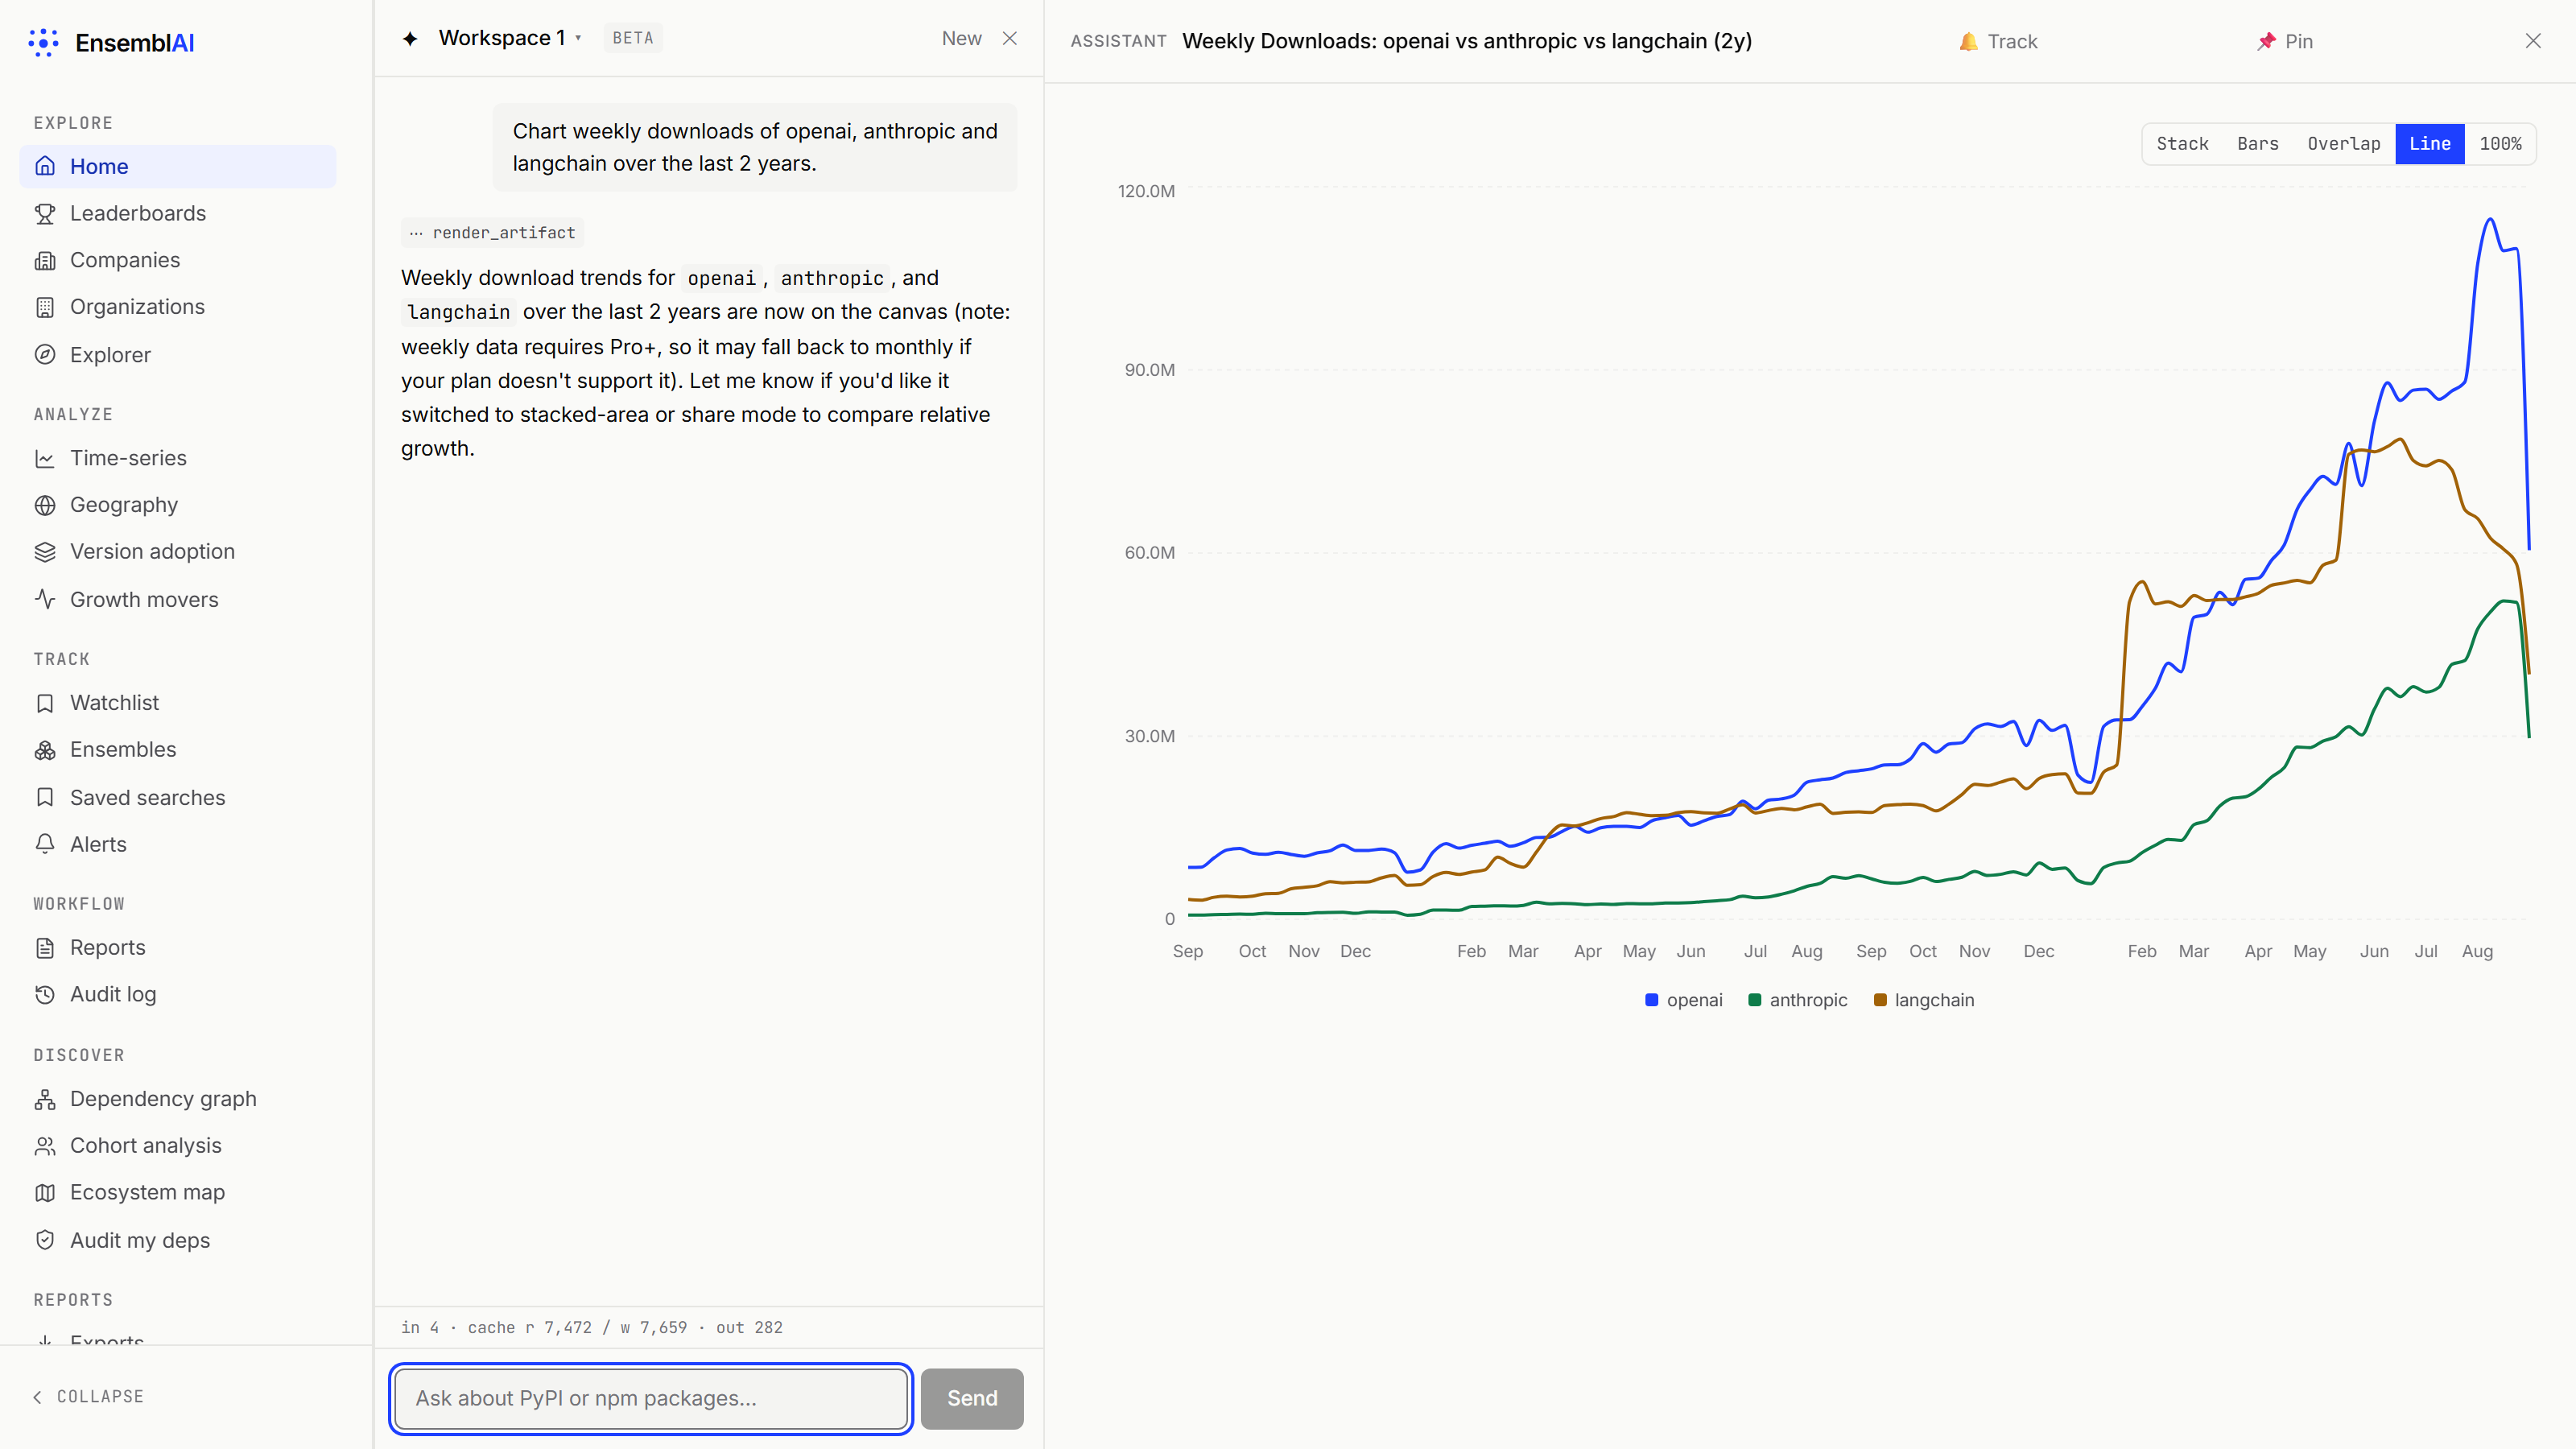
Live artifacts, never stale
Charts render from a query, not a snapshot — every reopen re-fetches current data. Five chart modes, series toggling, weekly granularity on Pro.
Workspaces that persist
Up to 10 named workspaces. Conversations, pinned charts, and context survive every session — pick up Friday's analysis on Monday.
Any chart → tracked alert
One click promotes an artifact into a threshold rule, evaluated hourly, delivered in-app. The chart you liked becomes the trend you watch.
Acts only with your approval
“Add these to my watchlist.” “Alert me at +10% MoM.” The agent prepares the change; nothing happens until you confirm it.
Monthly billing, no annual lock-in.
Free tier is free forever. Paid tiers prorate mid-cycle changes and include a soft overage cap so you can’t get a surprise bill.
Browse the dashboard, sample the data.
- · 12 months history, monthly resolution
- · 5 watchlist packages
- · 1 saved search
- · 10 rows per list · 50 on search
- · No API access
Do your research here.
- · 36 months history, monthly resolution
- · AI agent: 100 msgs/mo included, then $0.25/msg (capped)
- · Dep graph, cohort, version adoption, full ecosystem map
- · Alerts (25) + Ensembles (10) + Watchlist (100)
- · 50 CSV exports / month
Plug it into your stack.
- · Unlimited history, weekly + monthly resolution
- · AI agent: 500 msgs/mo + weekly artifacts, then $0.25/msg (capped)
- · REST API (20K calls/mo) + MCP for Claude & Cursor — included, not an enterprise add-on
- · Full dependency audit + audit log (90d)
Compare plans
| Feature | Free | Standard | Pro |
|---|---|---|---|
| Explore | |||
| Package, company & GitHub-org pages | |||
| Explorer with faceted search | |||
| Leaderboards | |||
| Rows per list | 10 · 50 on search | Full | Full |
| Compare & time-series | |||
| Geography | |||
| Growth movers | |||
| History depth | 12 months | 36 months | Unlimited |
| Resolution | Monthly | Monthly | Weekly + monthly |
| Version adoption | — | ||
| Discover | |||
| Ecosystem map | Preview | Full | Full |
| Dependency graph | — | ||
| Cohort analysis | — | ||
| Dependency CVE audit | Preview · 5 | Preview · 25 | Full |
| Track & work | |||
| AI agent | — | 100 msgs / mo, then $0.25 | 500 msgs / mo, then $0.25 |
| Agent overage cap | — | $25 / mo | $50 / mo |
| Watchlist | 5 packages | 100 | 100 |
| Saved searches | 1 | 25 | 25 |
| Ensembles | — | 10 | 50 |
| Alerts | — | 25 rules | 100 rules |
| Exports | — | 50 / mo · 10K rows | 500 / mo · 250K rows |
| Export formats | — | CSV | CSV, JSON, Parquet |
| Reports library | — | ||
| Audit log | — | — | 90 days |
| Programmatic | |||
| REST API | — | — | 20K calls / mo |
| MCP server | — | — | 5K calls / day |
| Support | |||
| Support | Community | Email · 5 days | Email · 2 days |
Need SAML SSO, custom retention, or higher API limits? Talk to us about Enterprise.
Start with the free tier in 30 seconds.
Sign in with Google, GitHub, or email. Upgrade to Pro when you’re ready for the API and weekly granularity.